
Where Does Utah's Electricity Come From?
An Overview of Utah's Current Electricity Generation Capabilities

Let’s take a look at Utah’s current electricity generating capacity and generation profiles. By reading this I intend for readers to learn something about:
What energy sources your electricity actually comes from
Differences in reliability of all energy sources
Note: At the very bottom, for reference, I will identify a few terms used and where the data comes from.
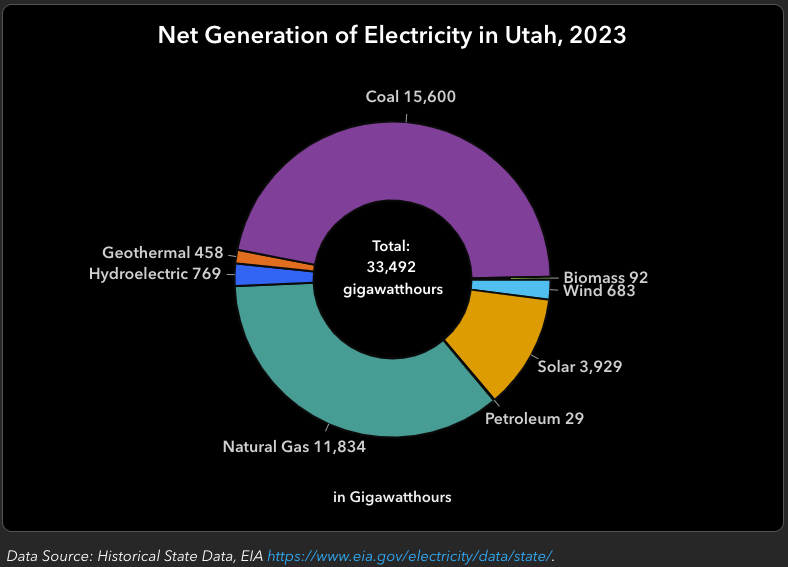
So, let’s take a look at what Utah’s electricity mix looks like, by source.
2023 Capacity, Generation, and Capacity Factor data
https://www.eia.gov/electricity/annual/
2023 Net Generation By Energy Source By state
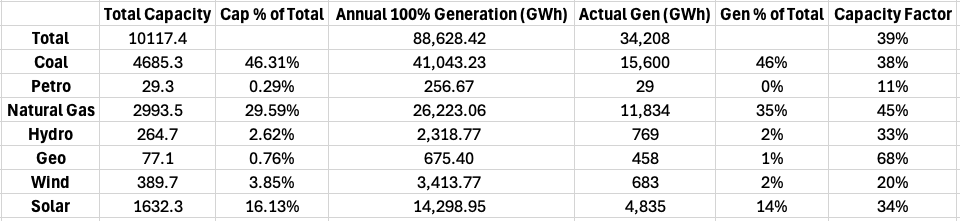
Some rankings, by source, of the above data:
% of Total Utah Electricity Rankings (Highest % to lowest %)
Coal (46%)
Natural Gas (35%)
Solar (14%)
Hydro (2%)
Wind (2%)
Geo (1%)
Summary: Coal and natural gas provide almost all of Utah’s electricity. Solar provides a pretty large chunk, which makes sense due to Utah being ranked #2 in the US for solar capacity. Hydro, wind, and geo are currently very small contributors.
Reliability Rankings (Most reliable to least reliable)
Geothermal (68% cap factor)
Natural Gas (45%)
Coal (38%)
Solar (34%)
Hydro (33%)
Wind (20%)
Summary: Geothermal is the most reliable source (can run at 100% for 68% of the year) by a bit. Natural gas is the second most reliable, leading me to believe there are more “combined cycle” turbines which provide baseload, more on that below. Coal and solar have decent reliability. Interestingly, solar actually has surprisingly good reliability in Utah at 34%, the US average in 2023 for solar was 23.3%. In Utah, likely due to good solar resources and poor wind resources, the reliability of wind and solar are almost exactly swapped.
Compared to the US average capacity factors, every source in Utah essentially matches up with the national average, except wind and solar which have swapped.

Emissions:
Utah is one of the highest emitting states for electricity generation, due to the high percentage of coal and natural gas for generation. Utah has slowly been decreasing their emissions intensity, but not as fast as other states.
You can see this visually here: Electricity Maps
You can see this numerically here: National Public Utilities Council
You can visually see the trend here: EIA.gov
Notes, by source
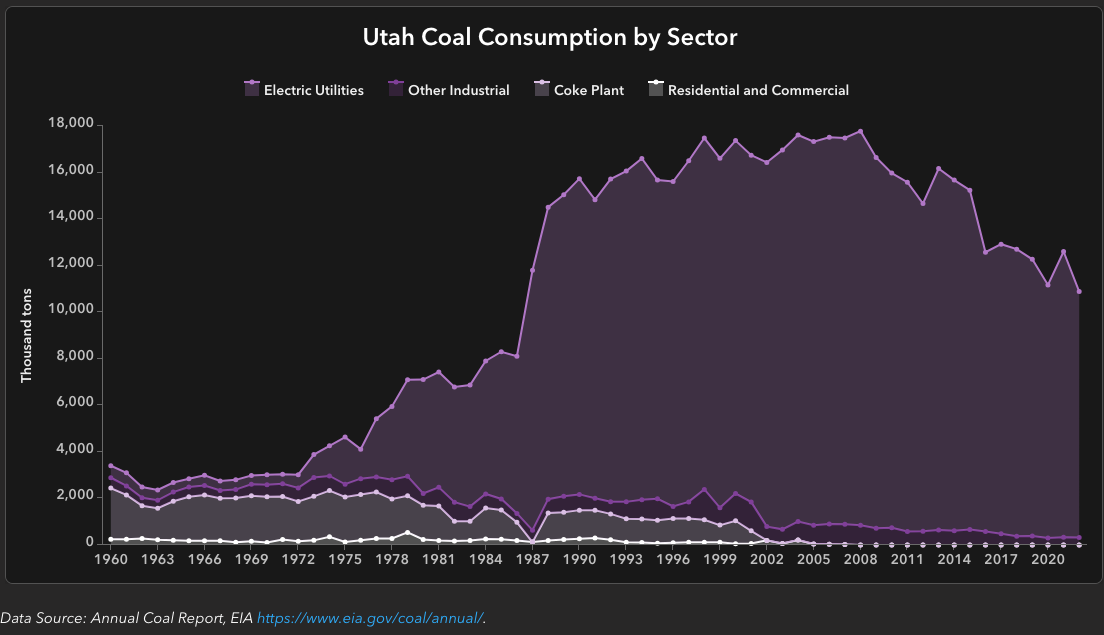
Coal:
Coal use in Utah has actually been on the decline for years, mainly due to natural gas displacing it
https://geology.utah.gov/apps/energy-resources/?page=Coal
“Demand for coal in Utah dropped 17% between 2015 and 2016, then remained steady (about 12.6 million tons) until 2020 when it dropped to about 11 million tons in response to the pandemic-related decline in electricity demand.”
AKA: Natural gas has been displacing (more below)
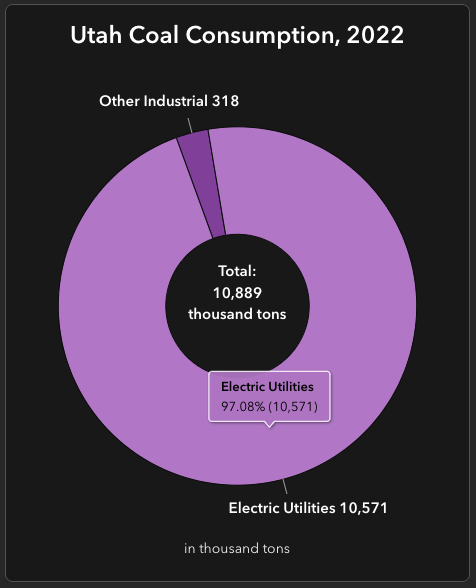
“Demand rebounded in 2021 back to 12.6 million short tons, but decreased again in 2022 to 10.9 million tons, 97% of which was burned at electric utilities.”


Petroleum (oil)
Relatively insignificant contribution, so I won’t dive into it much
"https://geology.utah.gov/apps/energy-resources/?page=Petroleum
“All five of Utah's refineries are located just north of Salt Lake City.”
“After peaking in 2013 at 896 million barrels, reserves retreated with falling prices but bounced back to 725 million barrels in 2022, an 11.5% increase from 2021’s 650 million barrels.”
Note: It doesn’t say anything really about electricity prices, likely due to petroleum only accounting for .28% of electricity generation
Natural Gas
I was unable to see how many of these turbines were “combined cycle” or “simple cycle” which would distinguish them as either “baseload” or “peaking”, respectively.
https://geology.utah.gov/apps/energy-resources/?page=Natural-Gas
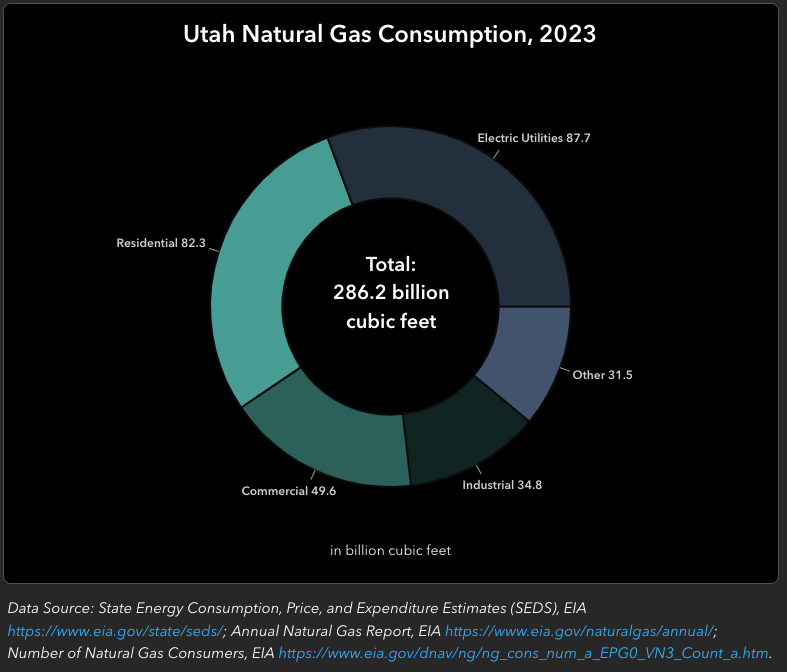
Besides electricity - “Natural gas is mostly used for home heating (residential, 27%)”
“starting in mid-2004, over 2,300 megawatts (MW) of new natural-gas-fired electric generating capacity has come online, greatly increasing the amount used by the electric utility sector (from 8% in 2005 to 29% in 2021).”
AKA: Largely displacing coal

Hydro:
https://geology.utah.gov/apps/energy-resources/?page=Hydroelectric
“Hydroelectricity is one of Utah’s top three renewable energy resources.”
Note: There are only 5 “renewables”: Wind, solar, hydro, geo, and maybe biomass, so being in the top 3 is maybe misleading… you be the judge :)
“Utah now has more than 60 hydroelectric power plants, mostly located in the northern part of the state.”
“In Utah, depending on the year, hydroelectricity ranks as the second or third largest share of utility-scale renewable energy generation.”
“The largest hydroelectric power plant in Utah is the Flaming Gorge power plant located on the Green River.”
“The Flaming Gorge plant has a capacity of 152 MW making it the most significant contributor to hydroelectric power in Utah.”
Note: East of the Uintas, North of Vernal
Geothermal:
Geothermal, while a small part of Utah’s current generation mix, could make big impact in the future
New geothermal, termed “Enhanced Geothermal Systems" could allow us to access geothermal energy ore reliably, but more on that in the next one piece
Some in-progress EGS projects:
Because of it’s high capacity factor / reliability, Geothermal could help to continually displace coal and eventually lessen the need for natural gas
I consider geothermal the “dark horse” of the clean energy sources, because it could end up making huge contributions and replacing fossil fuels on electric grids… Fingers Crossed!
https://geology.utah.gov/apps/energy-resources/?page=Geothermal
“In 2015, UGS staff published a paper in the Utah Geological Association’s Publication 44 titled “Geothermal Assessment and Modeling of the Uinta Basin”.”
“The findings indicate that depths greater than 2 kilometers (6,562 feet) have adequate temperatures (>50°C [122°F]) for direct-use applications, and wells with high volumetric fluid flow could use heat for small-scale onsite electric generation.”
“This finding is significant because many existing wells in the basin are deeper than 2 kilometers, and utilizing pre-existing well infrastructure will save development costs.”
“Utah has three such plants, all in Beaver County: Blundell (34 megawatts [MW], owned by PacifiCorp), Thermo No. 1 (14 MW, owned by Cyrq Energy), and Cove Fort (25 MW, owned by Enel Green Power), for a total capacity of 73 MW.”
“This current capacity represents only 0.1% of the total undeveloped geothermal resource potential in Utah, which is estimated at 49,400 MW.”
“Utah is one of seven states with utility-scale electricity generation from geothermal sources.”
“From 2013 to 2018, Utah’s geothermal plants were working at an average CF of around 75%. However, the average CF from 2019 to 2021 dropped to 55%, likely due to maintenance and upgrades to infrastructure.”

Solar:
Solar performs above average in Utah, attaining a capacity factor of 34% in 2023, compared to the US average of 23.3%.
I will admit that I was a bit against solar and more pro-wind in Utah due to the intermittent nature of each and the US average higher capacity factor being higher for wind… But now I will have to flip that viewpoint based on this data!
In Utah, solar is more reliable than wind, so I would rank solar above wind in Utah, but still below wind when considering the entire US
https://geology.utah.gov/apps/energy-resources/?page=Solar
“The state has an above-average number of sunny days per year and numerous cool, dry, flat areas that are conducive to solar electricity generation.”
“With a high ultraviolet (UV) index, due to our relatively high altitude, and investment in solar photovoltaic (PV) systems, Utah was ranked 9th in the U.S. for solar energy generating capacity according to the Energy Information Administration (EIA).”
“Utah currently has 38 utility-scale solar farms (as of early 2023) with a combined generating capacity of 1,539 MW. In 2022, 3,850 gigawatthours were generated from solar power, making up 10% of Utah’s total electricity generation.”
Note: This grew in 2023 to be ~14%, likely due to an increase in capacity and maybe more sun?
“Utah is ranked second in the nation for the highest solar capacity.”
“Smaller solar farms developed in the early days (2015–2016) have panels that are fixed in place and have a capacity factor that averages about 23% (annual average).”
“Larger and newer solar farms have transitioned to rotating panels that track the sun throughout the day. These solar farms have a capacity factor that averages about 29%.”
“As one would assume, the capacity factor increases in the spring and summer months to above 30%, whereas the fall and winter months average only about 16%.”
Note: The actual capacity factor from 2023 is 34% which is actually very impressive for solar
Wind:
As I mentioned above: In terms of reliability I’d now rank wind below solar in Utah, but still rank wind above solar across the US
https://geology.utah.gov/apps/energy-resources/?page=Wind
“Theoretically, these areas (in Utah) could support up to 9145 MW of wind-generating capacity.”
“Utah’s wind farms run at a capacity factor of about 23% to 25%, meaning they only produce about 25% of their rated capacity. This is much lower than windy states like Wyoming or Texas where wind capacity factors can reach up to 35%–40%.”
Note: This stated capacity factor is actually higher than the actual capacity factor from 2023, which was 20%
This is just an initial look at Utah’s electricity generation mix and the intent is to give the reader a general idea of where your electricity comes from. Hopefully you now have a better idea!
In the next one, we will look at some future plans for Utah’s electricity generation mix and what that could mean!
Terms/Meaning/Data Sources:
Capacity (or Nameplate capacity) refers to the maximum amount of electricity that can be generated at a single moment
Expressed in “MW” or Megawatts (1,000 kilowatts = 1 MW & 1,000 MW = 1 Gigawatt(GW))
2023 Capacity data
https://www.eia.gov/electricity/data/eia860/
“3_1_GeneratorYyyyy — Contains generator-level data for the surveyed generators”
Total Capacity: 10,117.4 MW
Generation refers to how much electricity that generator/source actually produces
Expressed in “MWh” or Megawatt hours
2023 Generation data
https://www.eia.gov/electricity/annual/
2023 Net Generation By Energy Source By state
Capacity Factor tells us the percentage of a year the generator/source generated electricity at its maximum nameplate capacity.
This value can be used as a proxy for “reliability” because it tells is how often a generator/source actually generates electricity.
To Calculate:
Divide “actual generation” by the “maximum generation potential”
Maximum Generation Potential (year)
365 days in a year, 24 hours in a day = 8,760 hours in a year
Capacity x 8,760 hours = maximum potential generation in a year